TL;DR : RATP Open Data (GTFS) –> JSON graph –> Dijkstra with Priority Queue in JS –> Firefox OS webapp
This is a Paris public transports route planning POC webapp.
DATA come from RATP (Paris Public Transports operator).
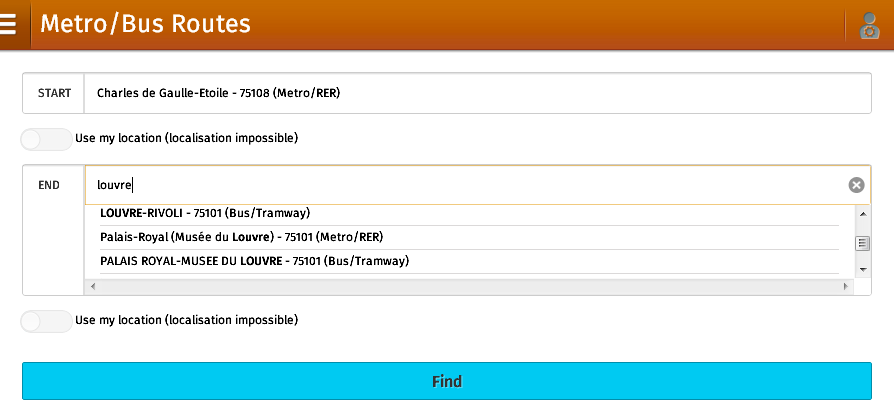
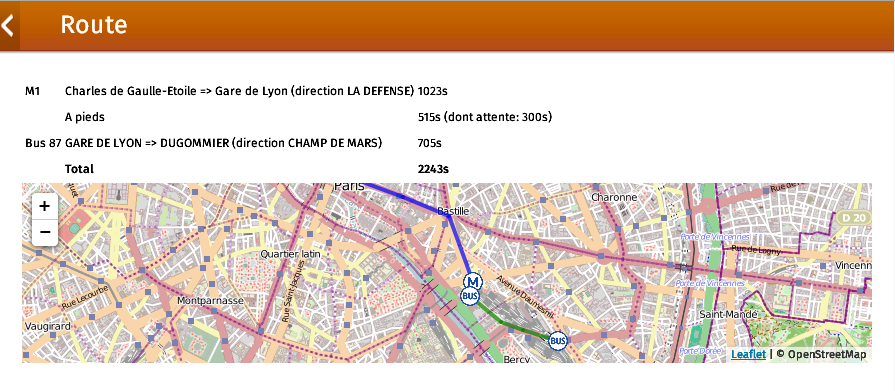
You can try it here : http://www.rombdn.com/fxos-metrobusparis/demo2/
Source : https://github.com/rombdn/fxos-metrobusparis
Source for the DATA transformation : https://github.com/rombdn/ratp-gtfs-to-json
External libs : Leaflet (map), Firefox OS Building Blocks, JQuery and Bootstrap (for autocompletion, didn’t have time to implement mine)
Background
When the RATP opened their data earlier this year I thought it was a good opportunity to create an offline route planning app acrosse the whole public transportation network.
The technical challenges were : – The full subway (metro) and bus graph, including edges with informations like durations, had to fit in less than a MB to minimize loading time – The shortest path search had to be fast.
Conception and implementation
DATA transformation (GTFS –> JSON Graph)
The DATA provided by RATP are 1GB of flat text files with informations on every route, trips, stop times for each day of the year…
Some simplifications I made :
- Collapse stations : in the original DATA, stations are duplicated for every direction (route) and every line. This would have leaded to an overly complicated graph
- Average durations and wait times
The final graph contains approximatly 6000 stations (stops) and around 3 edges per stations instead of 26000 stations and up to 20 edges per station.
Link to data transformation Github project : ratp-gtfs-to-json
Original DATA
Full description : http://data.ratp.fr/?eID=ics_od_datastoredownload&file=88
routes.txt : route_id, trip_id, type, line (directory)
trips.txt : route_id, trip_id
stop_times.txt : stop_id, trip_id, arrival_time
stops.txt : stop_id, stop_name
Graph output :
1 2 3 4 5 6 7 8 9 10 11 12 13 14 15 16 17 18 19 20 21 22 | |
This is achieved with 2 scripts : the first in C to parse the file stop_times.txt (650MB, millions of entry) to create the raw edges, and the second in ruby to create the graph (JSON format).
Javascript Shortest Path with Priority Queue
The first version was a straight forward implementation of Dijkstra’s algorithm. It was too slow so I decided to use a priority queue.
I started from a binary heap implementation from the book Eloquent Javascript by Marijn Haverbeke link.
Binary Heap with Keys source (idFunction is the method called to get the index).